


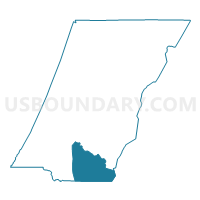
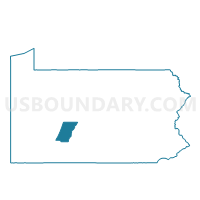
Census Tract 133, Cambria County, Pennsylvania
About
Outline

Summary
| Unique Area Identifier | 487170 |
| Name | Census Tract 133 |
| County | Cambria County |
| State | Pennsylvania |
| Area (square miles) | 46.20 |
| Land Area (square miles) | 46.08 |
| Water Area (square miles) | 0.12 |
| % of Land Area | 99.74 |
| % of Water Area | 0.26 |
| Latitude of the Internal Point | 40.28336970 |
| Longtitude of the Internal Point | -78.73610840 |
| Total Population | 5,972 |
| Total Housing Units | 2,722 |
| Total Households | 2,532 |
| Median Age | 45.8 |
Maps
Graphs
Select a template below for downloading or customizing gragh for Census Tract 133, Cambria County, Pennsylvania


Neighbors
Neighoring Census Tract (by Name) Neighboring Census Tract on the Map
- Census Tract 103, Cambria County, PA
- Census Tract 107, Cambria County, PA
- Census Tract 131, Cambria County, PA
- Census Tract 132, Cambria County, PA
- Census Tract 137, Cambria County, PA
- Census Tract 202, Somerset County, PA
- Census Tract 9602, Bedford County, PA
Top 10 Neighboring County Subdivision (by Population) Neighboring County Subdivision on the Map
- Richland township, Cambria County, PA (12,814)
- Adams township, Cambria County, PA (5,972)
- Paint township, Somerset County, PA (3,149)
- Summerhill township, Cambria County, PA (2,467)
- Croyle township, Cambria County, PA (2,339)
- Conemaugh township, Cambria County, PA (2,012)
- South Fork borough, Cambria County, PA (928)
- Ogle township, Somerset County, PA (501)
- Lincoln township, Bedford County, PA (425)
- Pavia township, Bedford County, PA (295)
Top 10 Neighboring Place (by Population) Neighboring Place on the Map
- Salix CDP, PA (1,149)
- Beaverdale CDP, PA (1,035)
- South Fork borough, PA (928)
- Sidman CDP, PA (431)
- St. Michael CDP, PA (408)
- Dunlo CDP, PA (342)
Top 10 Neighboring Unified School District (by Population) Neighboring Unified School District on the Map
- Richland School District, PA (14,921)
- Forest Hills School District, PA (12,657)
- Chestnut Ridge School District, PA (10,688)
- Windber Area School District, PA (8,881)
- Conemaugh Valley School District, PA (6,607)
Top 10 Neighboring State Legislative District Lower Chamber (by Population) Neighboring State Legislative District Lower Chamber on the Map
- State House District 78, PA (60,809)
- State House District 72, PA (58,097)
- State House District 73, PA (56,680)
- State House District 71, PA (54,822)
Top 10 Neighboring State Legislative District Upper Chamber (by Population) Neighboring State Legislative District Upper Chamber on the Map
- State Senate District 30, PA (239,492)
- State Senate District 35, PA (232,251)
- State Senate District 32, PA (225,580)
Top 10 Neighboring 111th Congressional District (by Population) Neighboring 111th Congressional District on the Map
Top 10 Neighboring 5-Digit ZIP Code Tabulation Area (by Population) Neighboring 5-Digit ZIP Code Tabulation Area on the Map
- 15904, PA (16,608)
- 15963, PA (11,114)
- 15956, PA (2,739)
- 15955, PA (2,551)
- 15521, PA (1,872)
- 16655, PA (1,601)
- 15952, PA (1,413)
- 15951, PA (453)
- 15930, PA (241)
- 15934, PA (218)
Data
Demographic, Population, Households, and Housing Units
** Data sources from census 2010 **
Show Data on Map
Download Full List as CSV
Download Quick Sheet as CSV
| Subject | This Area | Cambria County | Pennsylvania | National |
|---|---|---|---|---|
| POPULATION | ||||
| Total Population Map | 5,972 | 143,679 | 12,702,379 | 308,745,538 |
| POPULATION, HISPANIC OR LATINO ORIGIN | ||||
| Not Hispanic or Latino Map | 5,945 | 141,673 | 11,982,719 | 258,267,944 |
| Hispanic or Latino Map | 27 | 2,006 | 719,660 | 50,477,594 |
| POPULATION, RACE | ||||
| White alone Map | 5,905 | 135,206 | 10,406,288 | 223,553,265 |
| Black or African American alone Map | 9 | 5,222 | 1,377,689 | 38,929,319 |
| American Indian and Alaska Native alone Map | 2 | 147 | 26,843 | 2,932,248 |
| Asian alone Map | 11 | 729 | 349,088 | 14,674,252 |
| Native Hawaiian and Other Pacific Islander alone Map | 5 | 29 | 3,653 | 540,013 |
| Some Other Race alone Map | 5 | 588 | 300,983 | 19,107,368 |
| Two or More Races Map | 35 | 1,758 | 237,835 | 9,009,073 |
| POPULATION, SEX | ||||
| Male Map | 2,931 | 71,003 | 6,190,363 | 151,781,326 |
| Female Map | 3,041 | 72,676 | 6,512,016 | 156,964,212 |
| POPULATION, AGE (18 YEARS) | ||||
| 18 years and over Map | 4,822 | 115,444 | 9,910,224 | 234,564,071 |
| Under 18 years | 1,150 | 28,235 | 2,792,155 | 74,181,467 |
| POPULATION, AGE | ||||
| Under 5 years | 272 | 7,243 | 729,538 | 20,201,362 |
| 5 to 9 years | 289 | 7,707 | 753,635 | 20,348,657 |
| 10 to 14 years | 334 | 7,997 | 791,151 | 20,677,194 |
| 15 to 17 years | 255 | 5,288 | 517,831 | 12,954,254 |
| 18 and 19 years | 137 | 4,393 | 387,235 | 9,086,089 |
| 20 years | 76 | 2,136 | 191,942 | 4,519,129 |
| 21 years | 61 | 2,023 | 183,257 | 4,354,294 |
| 22 to 24 years | 172 | 4,853 | 498,947 | 12,712,576 |
| 25 to 29 years | 267 | 7,421 | 781,527 | 21,101,849 |
| 30 to 34 years | 286 | 7,665 | 729,592 | 19,962,099 |
| 35 to 39 years | 349 | 8,386 | 764,287 | 20,179,642 |
| 40 to 44 years | 414 | 8,860 | 851,382 | 20,890,964 |
| 45 to 49 years | 454 | 10,152 | 955,763 | 22,708,591 |
| 50 to 54 years | 532 | 11,760 | 984,641 | 22,298,125 |
| 55 to 59 years | 487 | 11,295 | 879,048 | 19,664,805 |
| 60 and 61 years | 158 | 4,022 | 312,575 | 7,113,727 |
| 62 to 64 years | 258 | 5,407 | 430,721 | 9,704,197 |
| 65 and 66 years | 140 | 2,900 | 231,623 | 5,319,902 |
| 67 to 69 years | 213 | 4,135 | 321,379 | 7,115,361 |
| 70 to 74 years | 259 | 5,648 | 426,536 | 9,278,166 |
| 75 to 79 years | 225 | 5,069 | 362,332 | 7,317,795 |
| 80 to 84 years | 185 | 4,675 | 311,761 | 5,743,327 |
| 85 years and over | 149 | 4,644 | 305,676 | 5,493,433 |
| MEDIAN AGE BY SEX | ||||
| Both sexes Map | 45.80 | 43.80 | 40.10 | 37.20 |
| Male Map | 45.00 | 41.90 | 38.70 | 35.80 |
| Female Map | 46.70 | 45.70 | 41.50 | 38.50 |
| HOUSEHOLDS | ||||
| Total Households Map | 2,532 | 58,950 | 5,018,904 | 116,716,292 |
| HOUSEHOLDS, HOUSEHOLD TYPE | ||||
| Family households: Map | 1,793 | 37,835 | 3,261,307 | 77,538,296 |
| Husband-wife family Map | 1,458 | 28,671 | 2,417,765 | 56,510,377 |
| Other family: Map | 335 | 9,164 | 843,542 | 21,027,919 |
| Male householder, no wife present Map | 110 | 2,754 | 229,495 | 5,777,570 |
| Female householder, no husband present Map | 225 | 6,410 | 614,047 | 15,250,349 |
| Nonfamily households: Map | 739 | 21,115 | 1,757,597 | 39,177,996 |
| Householder living alone Map | 658 | 18,390 | 1,433,415 | 31,204,909 |
| Householder not living alone Map | 81 | 2,725 | 324,182 | 7,973,087 |
| HOUSEHOLDS, HISPANIC OR LATINO ORIGIN OF HOUSEHOLDER | ||||
| Not Hispanic or Latino householder: Map | 2,521 | 58,462 | 4,823,358 | 103,254,926 |
| Hispanic or Latino householder: Map | 11 | 488 | 195,546 | 13,461,366 |
| HOUSEHOLDS, RACE OF HOUSEHOLDER | ||||
| Householder who is White alone | 2,519 | 56,658 | 4,264,337 | 89,754,352 |
| Householder who is Black or African American alone | 3 | 1,589 | 498,966 | 14,129,983 |
| Householder who is American Indian and Alaska Native alone | 0 | 49 | 9,573 | 939,707 |
| Householder who is Asian alone | 3 | 235 | 109,060 | 4,632,164 |
| Householder who is Native Hawaiian and Other Pacific Islander alone | 1 | 13 | 1,127 | 143,932 |
| Householder who is Some Other Race alone | 1 | 87 | 82,237 | 4,916,427 |
| Householder who is Two or More Races | 5 | 319 | 53,604 | 2,199,727 |
| HOUSEHOLDS, HOUSEHOLD TYPE BY HOUSEHOLD SIZE | ||||
| Family households: Map | 1,793 | 37,835 | 3,261,307 | 77,538,296 |
| 2-person household Map | 928 | 18,696 | 1,442,819 | 31,882,616 |
| 3-person household Map | 395 | 8,634 | 767,169 | 17,765,829 |
| 4-person household Map | 318 | 6,503 | 620,755 | 15,214,075 |
| 5-person household Map | 112 | 2,734 | 271,611 | 7,411,997 |
| 6-person household Map | 28 | 880 | 98,268 | 3,026,278 |
| 7-or-more-person household Map | 12 | 388 | 60,685 | 2,237,501 |
| Nonfamily households: Map | 739 | 21,115 | 1,757,597 | 39,177,996 |
| 1-person household Map | 658 | 18,390 | 1,433,415 | 31,204,909 |
| 2-person household Map | 76 | 2,340 | 262,684 | 6,360,012 |
| 3-person household Map | 2 | 259 | 36,955 | 992,156 |
| 4-person household Map | 2 | 93 | 16,687 | 411,171 |
| 5-person household Map | 1 | 19 | 4,799 | 126,634 |
| 6-person household Map | 0 | 6 | 1,720 | 48,421 |
| 7-or-more-person household Map | 0 | 8 | 1,337 | 34,693 |
| HOUSING UNITS | ||||
| Total Housing Units Map | 2,722 | 65,650 | 5,567,315 | 131,704,730 |
| HOUSING UNITS, OCCUPANCY STATUS | ||||
| Occupied Map | 2,532 | 58,950 | 5,018,904 | 116,716,292 |
| Vacant Map | 190 | 6,700 | 548,411 | 14,988,438 |
| HOUSING UNITS, OCCUPIED, TENURE | ||||
| Owned with a mortgage or a loan Map | 1,061 | 21,964 | 2,268,674 | 52,979,430 |
| Owned free and clear Map | 1,034 | 21,428 | 1,223,048 | 23,006,644 |
| Renter occupied Map | 437 | 15,558 | 1,527,182 | 40,730,218 |
| HOUSING UNITS, VACANT, VACANCY STATUS | ||||
| For rent Map | 42 | 1,479 | 135,262 | 4,137,567 |
| Rented, not occupied Map | 4 | 102 | 9,386 | 206,825 |
| For sale only Map | 21 | 842 | 64,818 | 1,896,796 |
| Sold, not occupied Map | 17 | 314 | 20,131 | 421,032 |
| For seasonal, recreational, or occasional use Map | 30 | 944 | 161,582 | 4,649,298 |
| For migrant workers Map | 0 | 3 | 411 | 24,161 |
| Other vacant Map | 76 | 3,016 | 156,821 | 3,652,759 |
| HOUSING UNITS, OCCUPIED, AVERAGE HOUSEHOLD SIZE BY TENURE | ||||
| Total: Map | 2.35 | 2.30 | 2.45 | 2.58 |
| Owner occupied Map | 2.41 | 2.42 | 2.57 | 2.65 |
| Renter occupied Map | 2.05 | 1.96 | 2.16 | 2.44 |
| HOUSING UNITS, OCCUPIED, TENURE BY RACE OF HOUSEHOLDER | ||||
| Owner occupied: Map | 2,095 | 43,392 | 3,491,722 | 75,986,074 |
| Householder who is White alone Map | 2,086 | 42,569 | 3,140,005 | 63,446,275 |
| Householder who is Black or African American alone Map | 1 | 498 | 228,851 | 6,261,464 |
| Householder who is American Indian and Alaska Native alone Map | 0 | 23 | 4,562 | 509,588 |
| Householder who is Asian alone Map | 2 | 118 | 62,204 | 2,688,861 |
| Householder who is Native Hawaiian and Other Pacific Islander alone Map | 1 | 7 | 544 | 61,911 |
| Householder who is Some Other Race alone Map | 1 | 33 | 30,761 | 1,975,817 |
| Householder who is Two or More Races Map | 4 | 144 | 24,795 | 1,042,158 |
| Renter occupied: Map | 437 | 15,558 | 1,527,182 | 40,730,218 |
| Householder who is White alone Map | 433 | 14,089 | 1,124,332 | 26,308,077 |
| Householder who is Black or African American alone Map | 2 | 1,091 | 270,115 | 7,868,519 |
| Householder who is American Indian and Alaska Native alone Map | 0 | 26 | 5,011 | 430,119 |
| Householder who is Asian alone Map | 1 | 117 | 46,856 | 1,943,303 |
| Householder who is Native Hawaiian and Other Pacific Islander alone Map | 0 | 6 | 583 | 82,021 |
| Householder who is Some Other Race alone Map | 0 | 54 | 51,476 | 2,940,610 |
| Householder who is Two or More Races Map | 1 | 175 | 28,809 | 1,157,569 |
| HOUSING UNITS, OCCUPIED, TENURE BY HISPANIC OR LATINO ORIGIN OF HOUSEHOLDER | ||||
| Owner occupied: Map | 2,095 | 43,392 | 3,491,722 | 75,986,074 |
| Not Hispanic or Latino householder Map | 2,084 | 43,166 | 3,408,824 | 69,617,625 |
| Hispanic or Latino householder Map | 11 | 226 | 82,898 | 6,368,449 |
| Renter occupied: Map | 437 | 15,558 | 1,527,182 | 40,730,218 |
| Not Hispanic or Latino householder Map | 437 | 15,296 | 1,414,534 | 33,637,301 |
| Hispanic or Latino householder Map | 0 | 262 | 112,648 | 7,092,917 |
| HOUSING UNITS, OCCUPIED, TENURE BY HOUSEHOLD SIZE | ||||
| Owner occupied: Map | 2,095 | 43,392 | 3,491,722 | 75,986,074 |
| 1-person household Map | 467 | 10,598 | 767,169 | 16,453,569 |
| 2-person household Map | 883 | 17,133 | 1,304,206 | 27,618,605 |
| 3-person household Map | 330 | 7,012 | 596,731 | 12,517,563 |
| 4-person household Map | 282 | 5,435 | 499,363 | 10,998,793 |
| 5-person household Map | 102 | 2,238 | 210,370 | 5,057,765 |
| 6-person household Map | 22 | 668 | 72,113 | 1,965,796 |
| 7-or-more-person household Map | 9 | 308 | 41,770 | 1,373,983 |
| Renter occupied: Map | 437 | 15,558 | 1,527,182 | 40,730,218 |
| 1-person household Map | 191 | 7,792 | 666,246 | 14,751,340 |
| 2-person household Map | 121 | 3,903 | 401,297 | 10,624,023 |
| 3-person household Map | 67 | 1,881 | 207,393 | 6,240,422 |
| 4-person household Map | 38 | 1,161 | 138,079 | 4,626,453 |
| 5-person household Map | 11 | 515 | 66,040 | 2,480,866 |
| 6-person household Map | 6 | 218 | 27,875 | 1,108,903 |
| 7-or-more-person household Map | 3 | 88 | 20,252 | 898,211 |
Loading...